What is a Gantt chart?
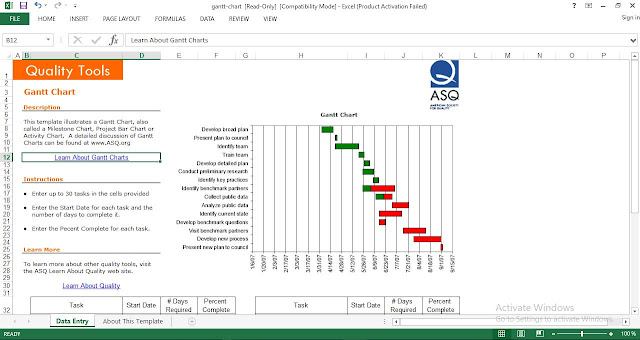
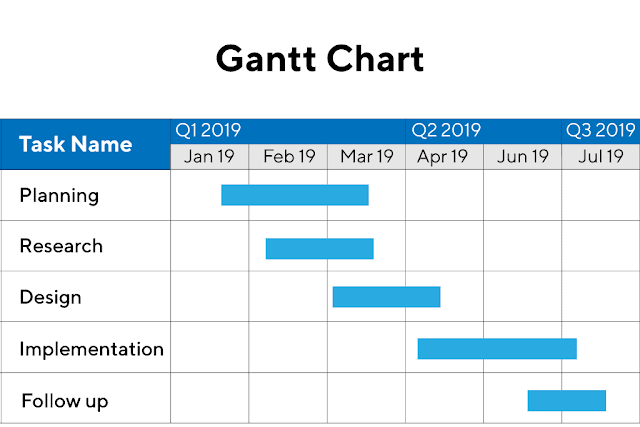
Fundamentally, a Gantt chart is a bar chart where each bar represents the start and finish dates of every event or task. It can be used as a team calendar, a project calendar, or both depending on your needs.
Project Manager define A Gantt chart is a bar chart that provides a visual view of project tasks scheduled over time. A Gantt chart is used for project planning: it’s a useful way of showing what work is scheduled to be done on specific days. It helps project managers and team members view the start dates, end dates and milestones of a project schedule in one simple stacked bar chart.
On a Gantt chart you can easily see:
- The start date of the project schedule
- What the project tasks are
- Which team member is working on each task
- When tasks start and finish
- How long each task will take
- How tasks group together, overlap and link with each other
- Task dependencies, milestones and the critical path of your project
- The finish date of the project
The vertical axis of a Gantt chart shows the tasks that need to be completed, while the horizontal axis represents the project timeline. As you input tasks, their start dates, their end dates and their dependencies, bars on the stacked bar chart will populate, which represent task durations. This happens automatically if you use a project management tool equipped with a Gantt chart maker.
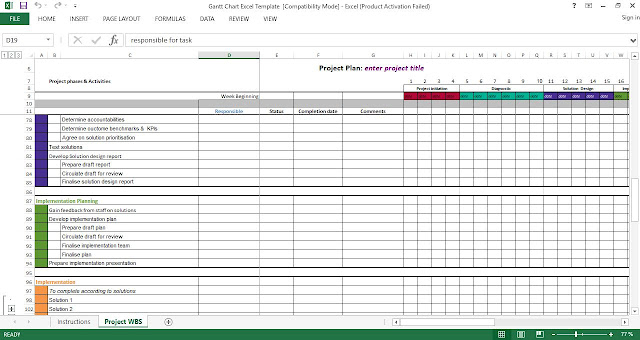
Most Gantt diagrams are created in Excel or with project management software, which is sometimes referred to as Gantt chart software. If you choose to make Gantt charts with Gantt chart software, instead of using an Excel Gantt chart template, then you’ll be able to do more than see task durations and due dates.
With Gantt chart software, you can create a work breakdown structure, assign tasks to team members, track project progress in real time and drag and drop timelines to instantly update your project schedule.
Simple gantt chart template in excel
Download also:


Post a Comment