 |
| kPI Dashboard Excel Template Free Download |
kPI Dashboard Excel Template Free Download
This kPI Dashboard Excel Template is designed to show performance across Key Performance Indicators (KPIs) selected by your organization in relation to targets or goals for these indicators. The dashboard is intended to be updated with actual data from the organization's accounting, fundraising, program, and/or other systems of record on a quarterly basis after the data has been reviewed, reconciled and/or closed, as applicable. The user defines both the KPIs and the targets against which they are measured.
kPI Dashboard Template Structure
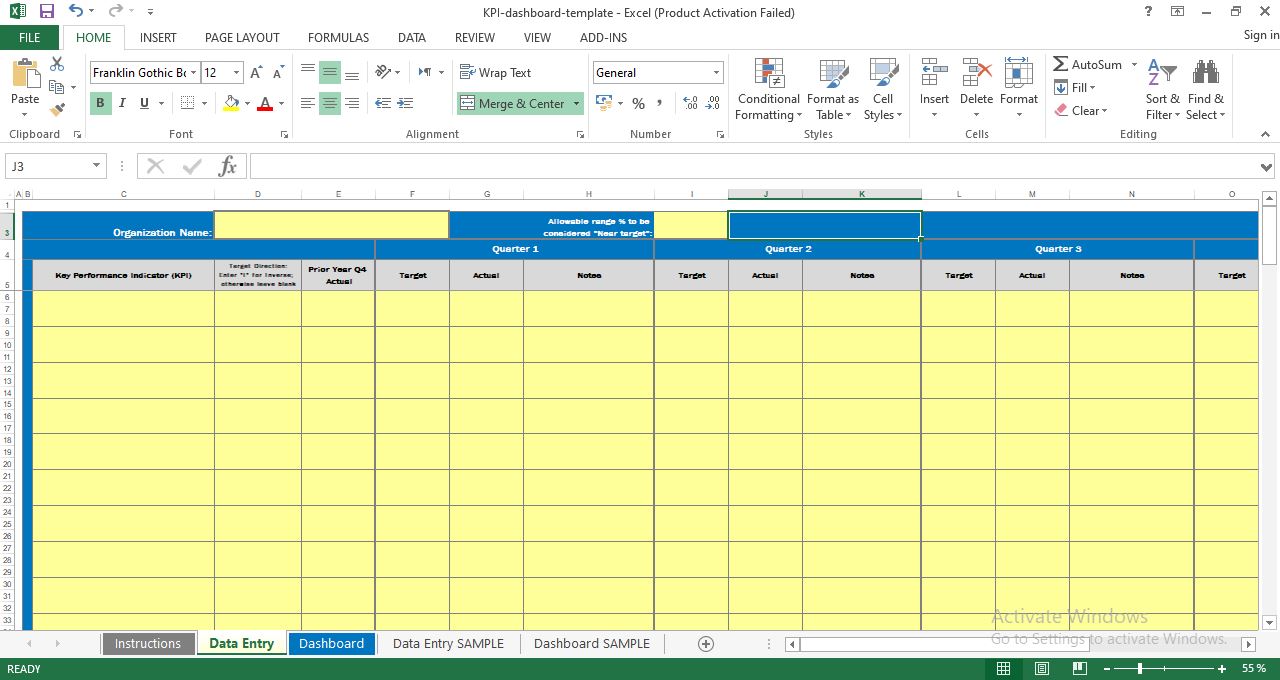
Data for each quarter (both targets and actuals) should be maintained in the Data Entry tab. The Dashboard tab will populate and report on each reporting period as selected.
The Instruction to Completing kPI Dashboard Template
1-Cell D3: Organization Name Enter the name of your organization in cell D3.
2-Cell I3: Allowable Range % to be considered ""Near Target"" The number entered into this cell will be the percentage range below ""target"" that allows a result to be presented as ""Near target."" For example, entering a 5 in this cell will mean that any result within 5% of the set target will be presented as ""Near target.
3-Column C: Key Performance Indicator (KPI) Enter the name of each KPI you would like to monitor (up to 11) in the rows of Column C, including any descriptors necessary for users entering and/or interpreting data (e.g. whether the metric is cumulative or by quarter).
4-Column D: Target Direction Indicator By default, it is assumed that the goal is for an indicator to be numerically equal to or greater than the target defined in column F. If the goal is ""inverse,"" in other words if the goal is to be equal to or below the defined target, enter an ""I"" in this column. (For example, the goal for a KPI such as total debt or employee turnover would be to be equal to or below the target.)
5-Column E: Prior Year Q4 Actual Enter the relevant data from the fourth quarter of the prior year. " "Column F: Target Enter the numerical target or goal for the first quarter of the year for each KPI in the row corresponding to that indicator.
6-Column G: Current Period Actual Enter the actual result from the first quarter of the year for each KPI in the row corresponding to that indicator. Be sure to use the same unit (number, percentage, etc.) as used for the target measure.
7-Column H: Notes Write any relevant notes related to particular KPIs for the first quarter of the year, their targets or criteria, and/or their performance.
8-Columns I - Q: Target, Current Period Actual, Notes Enter the numerical target, current period actual, and notes for each KPI for the second, third and fourth quarters of the year.
Dashboard Instructions ("Dashboard" tab):
Cell E4: Reporting Period Select the quarter you wish to report on from the drop down menu in Cell E4. Dashboard will update accordingly, showing results for the selected quarter for each KPI.
Note: cells in the Dashboard are not specifically formatted. To show dashboard data in an appropriate format based on the type of data being presented (accounting or percentage), select the cells to be formatted and choose the appropriate format from the "Number" section of the Home ribbon above.
kPI Dashboard Template Excel Sample
 |
| kPI Dashboard Excel Template Free Download |
Download also:

Post a Comment