 |
| Free HR Dashboard Template in Excel |
Free HR Dashboard Template in Excel
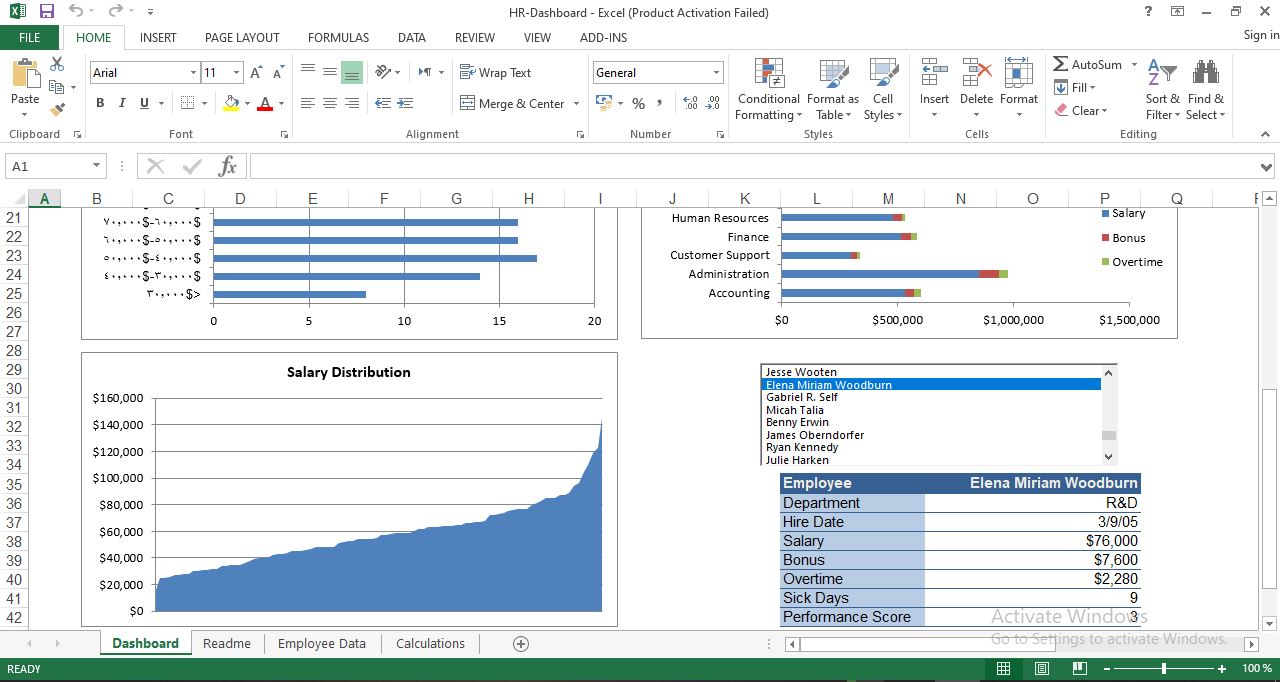
This is a HR Dashboard for a sample data. You can enter your data in "Employee Data" sheet. An HR dashboard is a business intelligence tool that allows Human Resource teams to track, analyze and report on HR KPIs.
Modern, interactive dashboards leverage an HR analytics platform which makes it easy to combine data from all systems and to deeply explore this data directly within the dashboard. This way, HR teams can quickly find insights that will improve recruiting, optimize workplace management and enhance employee performance.
HR Dashboard Examples
1-Executive HR Dashboard
Human resource executives need to be able to quickly review and analyze all critical KPIs in one place. This example displays high-level metrics such as employees by role and by location and key ratios such as gender and training.
 |
| Image source: qlik.com |
2-Employee Performance Dashboard
Employee performance dashboards help HR teams and business managers understand the effectiveness, satisfaction and goal progress of their workforce. To analyze compensation vs. performance this example shows the number of active employees by rating level and salary by employee rating.
 |
| Image source: qlik.com |
3-Employee Development Dashboard
Employees are the most important asset within an organization. This HR dashboard example shows an HR leader training program metrics such as completion percentage, hours and cost. Interactive charts allow the user to break out data by dimensions like department, program, gender and more.
 |
| Image source: qlik.com |
4-Workforce Demographics Dashboard
HR executives strive to maintain a diverse and balanced workforce, so they need to fully understand the demographic characteristics of their employees. This HR dashboard template allows them to deeply analyze data on age, gender, location, department and ethnic groups.
 |
| Image source: qlik.com |
5-Workforce Diversity Dashboard
Using an interactive dashboard, HR professionals can dig deeper into demographic data and analyze one variable, such as ethnic diversity. This example shows the number of employees for each ethnicity and breaks out the data by country and by salary.
 |
| Image source: qlik.com |
Watch How To Build Interactive Excel Dashboards
In this video you will learn how to create an interactive HR dashboard from scratch using Excel's Power Query and Power Pivot tools.
Download also:
Reference: qlik

Post a Comment