
 |
| Agile Burn Up Chart Template in Excel |
Free Agile Burn Up Chart Template Excel
A burn up chart is a graph that shows project progress over time. There are two main lines shown on the chart: one for the total project work planned, and the other for tracking the work completed to date. By comparing the work your team has accomplished so far with the total amount of work planned, you can understand how efficiently they’re working and better estimate how long it will take to complete the work remaining.
What are the benefits of a burn up chart?
A sprint burn up chart helps your Agile team monitor how efficient they are from one sprint to the next. It also helps everyone keep track of how much work is left and whether you can expect to complete the project on time based on your progress rate so far.
If your team was completing 20 SPs per sprint and now suddenly they only completed 10 SPs, your burn up chart will highlight that change. This makes it easier for you to spot differences and investigate them to see if a bottleneck or issue is slowing your team.
During a project, you can extend the actual work completed line to help predict when the project will end. This can help you estimate project length. It also allows you to be proactive about monitoring progress and discussing what you can do if it looks like the project isn’t going to finish on schedule.
Plus, a burn up chart monitors your overall scope and how that impacts your project length. What does scope mean in project management? It's essentially all of the requirements and objectives that a project needs to be a success. Your burn up chart is an easy way to show your client and other stakeholders how much longer the project should take if they want additional work added.
Free Agile Burn Up Chart Template
 |
| Image source: eforexcel.com |
 |
| Image source: eforexcel.com |
 |
| Image source: eforexcel.com |
 |
| Image source: eforexcel.com |
How to Use Agile Burn Up Chart Template
On the first tab, you can choose the name for your legends - Scope Planned, Scope Completed, Ideal Burnup are defaults. You can change it to as per your requirements.
Input tab can be used to input data. You can use this for a single iteration or for multiple iterations.
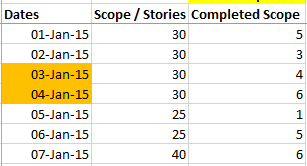
In column A - You can put the dates. If a weekend is inputted, it will be highlighted in Orange to let you know that a weekend date has been chosen. Required validation that only a date can be entered has been put in.
In column B - You can put your Scope say Stories or Effort. The effort will be total effort for the Sprint / Iteration. If the Scope / Effort changes, you should change this as of that date.
In Column C - You need to input the Stories / Effort completed as on that date (This is not a cumulative value). The validations put here are following - Column C input can not be greater than Column B. Total of Column C can not be greater than that last entry of column B which is the final Scope.
Download also:
Post a Comment