
 |
| Simple Gantt Chart Template |
Simple Gantt Chart Template Free Download
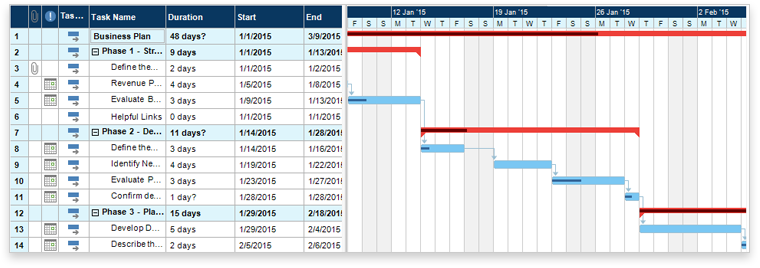
A Gantt chart, commonly used in project management, is one of the most popular and useful ways of showing activities (tasks or events) displayed against time. On the left of the chart is a list of the activities and along the top is a suitable time scale. Each activity is represented by a bar; the position and length of the bar reflects the start date, duration and end date of the activity.
This allows you to see at a glance:
- What the various activities are
- When each activity begins and ends
- How long each activity is scheduled to last
- Where activities overlap with other activities, and by how much
- The start and end date of the whole project
To summarize, a Gantt chart shows you what has to be done (the activities) and when (the schedule).
 |
| Image source: gantt.com |
Learn How To Build A Gantt Chart in Excel
Download also:
Post a Comment